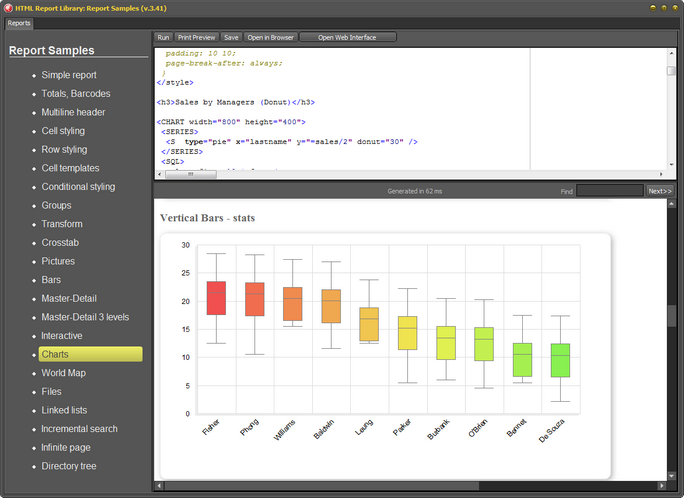
Use boxplot="true" attribute to display box-and-whiskers diagram. Example:
<S type="vbar" x="lastname" y="sales" q1="q1" q2="q2" q3="q3" qmin="qmin" qmax="qmax" boxplot="true"/>
|
<< Click to Display Table of Contents >> Navigation: Delphi HTML Report Library > Charts > Box-and-whiskers diagram |
Use boxplot="true" attribute to display box-and-whiskers diagram. Example:
<S type="vbar" x="lastname" y="sales" q1="q1" q2="q2" q3="q3" qmin="qmin" qmax="qmax" boxplot="true"/>