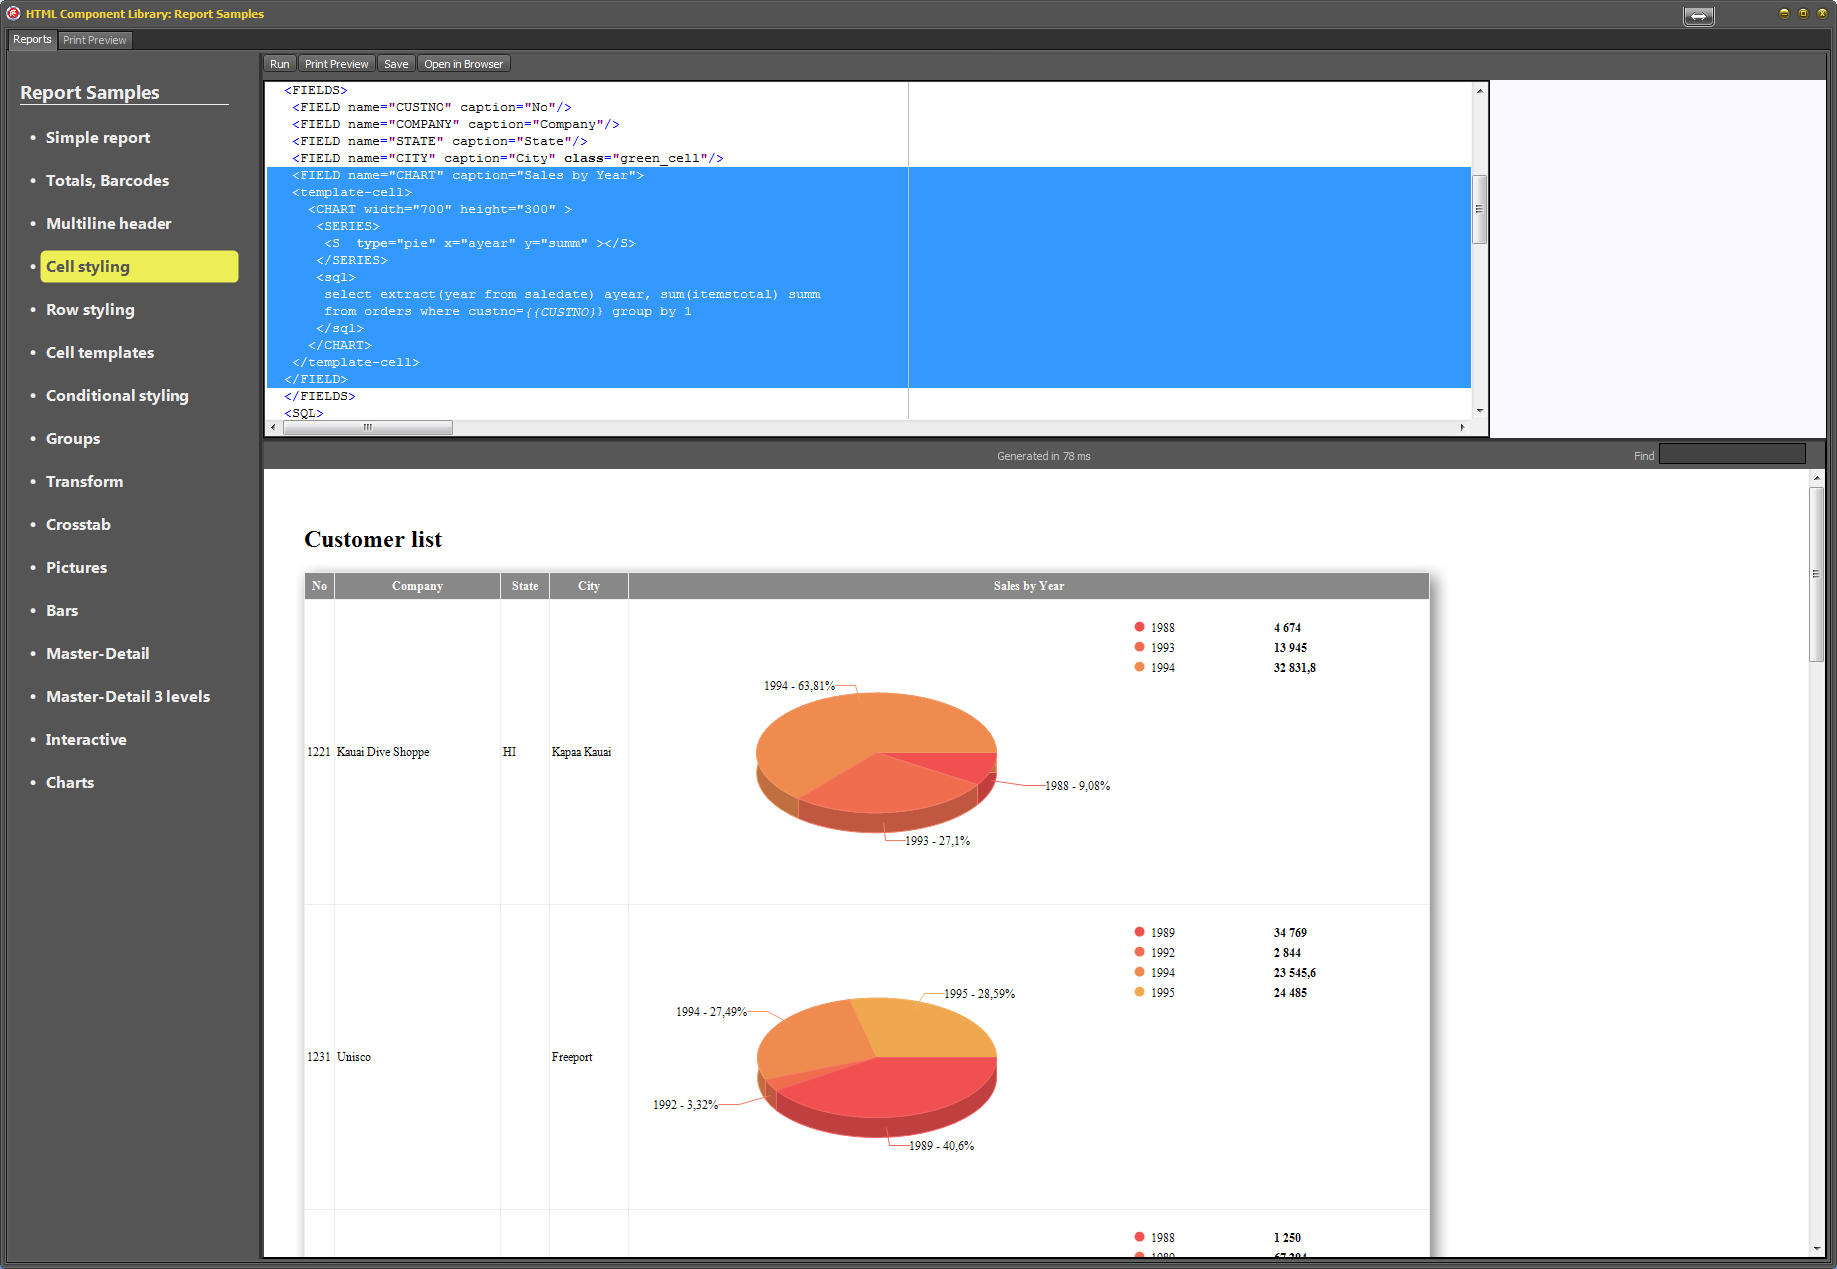
Charts could be generated in any template of a table (DATAPACKET) – in table, row or cell.
Example of inserting chart into table cell.
Cell template:
<FIELD name="CHART" caption="Sales by Year">
<template-cell>
<CHART width="700" height="300" >
<SERIES>
<S type="pie" x="ayear" y="summ"></S>
</SERIES>
<sql>
select extract(year from saledate) ayear, sum(itemstotal) summ
from orders where custno={{CUSTNO}} group by 1
</sql>
</CHART>
</template-cell>
</FIELD>
Result
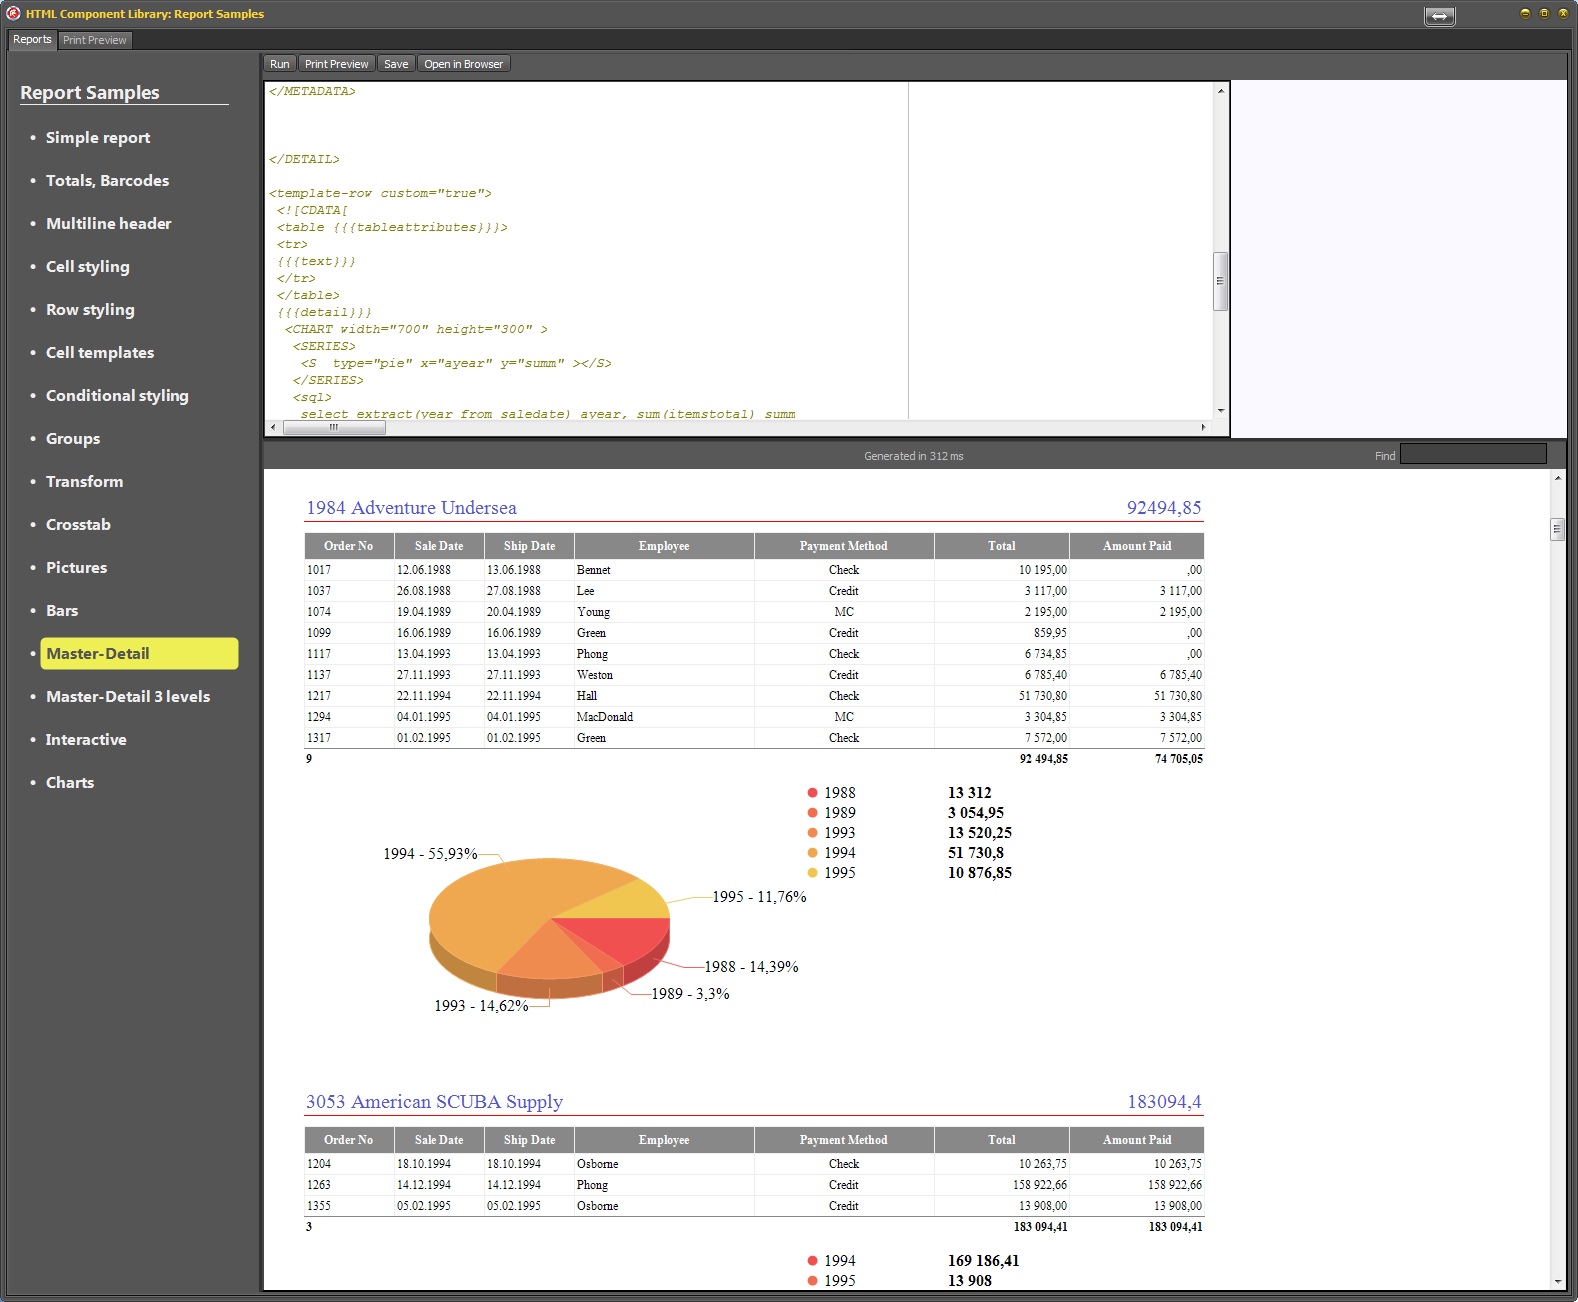
Example of generating chart after detail table:
<template-row custom="true">
<![CDATA[
<table {{{tableattributes}}}>
<tr>
{{{text}}}
</tr>
</table>
{{{detail}}}
<CHART width="700" height="300" >
<SERIES>
<S type="pie" x="ayear" y="summ" ></S>
</SERIES>
<sql>
select extract(year from saledate) ayear, sum(itemstotal) summ
from orders where custno={{CUSTNO}} group by 1
</sql>
</CHART>
]]>
</template-row>
Result: